
Intent:
Analyze the relationship of sentiment (from tweets on Ethereum) on price and volume of Ethereum.
The Process:
- The starting point was to analyze the tweets of Vitalik Buterin (Founder of Ethereum)
- We fetched 3195 tweets by scraping Twitter and classified them as
- Tweets on Ethereum and
- Tweets on Non Ethereum
- We then analyzed the sentiment of all 3195 tweets using Text Blob (a Python Package)
- Took the top 10 mentions of people (mentioned by him by number of times on the topic of Ethereum) and thereafter extracted the top mentions by those people as well
- In all we extracted a total of 110 users with 78 unique users
Figure 1:
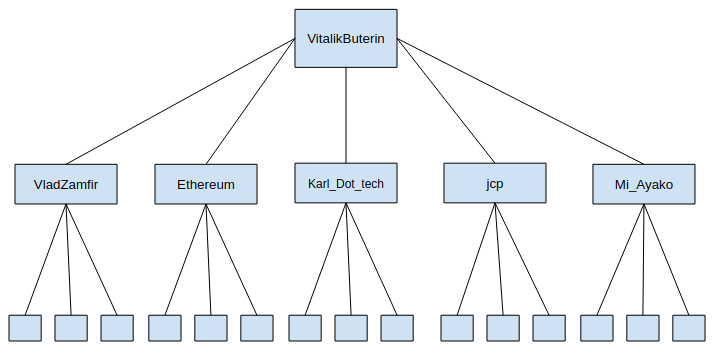
Ethereum data
To be able to compare and analyze the effect of Tweets about Ethereum on the price/volume (of Ethereum) we had to get reliable data of price and volume for each day, and for that we pulled data from coinmarketcap.com. The stream contained information on Open Price, Close Price, Low Price, High Price, Volume and Market Cap.
Analysis
- First, we took all the tweets on #Ethereum that had a mention of any of the 78 unique users. This totaled to 11,325 Tweets (1st July 2017 to 1st July 2018).
- We then drew a correlation between Ethereum data and the Twitter data using the Spearman correlation method. Two major correlations were executed
-
Cross correlation with present dayís twitter data vs. next dayís Ethereum data & then with present day twitter data vs. the day after next Ethereum data and so on as illustrated below
- Ethereum data (present day) with Twitter data (present day)
- Ethereum data (next day (T+1)) with Twitter data (present day)
- Ethereum data (day after (T+2)) with Twitter data (present day)
- Ethereum Data (two days after (T+3)) with Twitter data (present day)
- Correlating the past three days Twitter data (summed up using Exponential Smoothing) with present days Ethereum data. Note: On analysis it was found that the Ethereum price changed drastically during mid-December (2017) to mid-March (2018) because of external factors. We decided to remove the data of that specific period while executing the correlation.
Outcome:
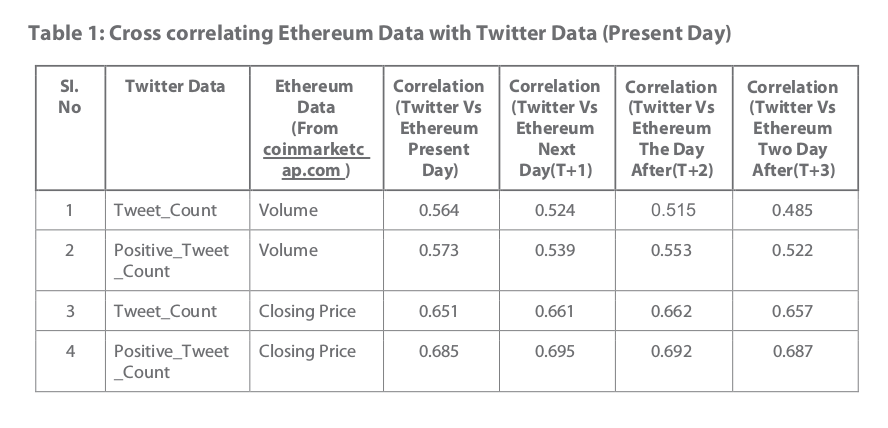 Results for Table 1:
Figure 2 is the graph representing each day of Positive Tweet Count (in x-Axis) with Closing Price of Ethereum (in y-axis). The correlation was done with present day Twitter data and present day Ethereum data. Result of correlation: 0.573 (better than the correlation we get in T+1, T+2 & T+3)
Figure 3 is the graph representing each day of Positive Tweet Count (in x-Axis) with volume of Ethereum (in y-axis). The correlation was done with present day twitter data and present day Ethereum data. Result of correlation: 0.685 It was found that one day previous data of Twitter have more effect on Ethereum volume than present day twitter data.
Figure 4 4 is the graph representing each day of Positive Tweet Count (in x-Axis) with Closing Price of Ethereum (in y-axis). The correlation was done with present day twitter data and next day (T+1) Ethereum data. Result of correlation: 0.539 It shows that previous dayís Twitter data has less effect on Ethereum price while compared to the present day Twitter data.
Figure 5 is the graph representing each day of Positive Tweet Count (in x-Axis) with volume of Ethereum (in y-axis). The correlation was done with present day twitter data and next day (T+1) Ethereum data. Result of correlation: 0.695 One day previous Twitter data have the best correlation with present day Ethereum Volume.
Figure 6 is the graph representing each day of Positive Tweet Count (in x-Axis) with Closing Price of Ethereum (in y-axis). The correlation was done with present day twitter data and the day after (T+2) Ethereum data. Result of correlation: 0.553 It shows the correlation of Positive tweet count and Ethereum price falls down when we cross correlate with old Twitter data with present day Ethereum data.
Figure 7 is the graph representing each day of Positive Tweet Count (in x-Axis) with volume of Ethereum (in y-axis). The correlation was done with present day twitter data and the day after (T+2) Ethereum data. Result of correlation: 0.692 One day previous Twitter data have more correlation with present day Ethereum Volume that is shown in Figure 5.
Figure 8 is the graph representing each day of Positive Tweet Count (in x-Axis) with Closing Price of Ethereum (in y-axis). The correlation was done with present day twitter data and two day after (T+3) Ethereum data. Result of correlation: 0.522 The correlation result keeps on decreasing as we go back in time.
Figure 9 is the graph representing each day of Positive Tweet Count (in x-Axis) with volume of Ethereum (in y-axis). The correlation was done with present day twitter data and two day after (T+3) Ethereum data. Result of correlation: 0.687 The correlation result keeps on decreasing as we go back in time.
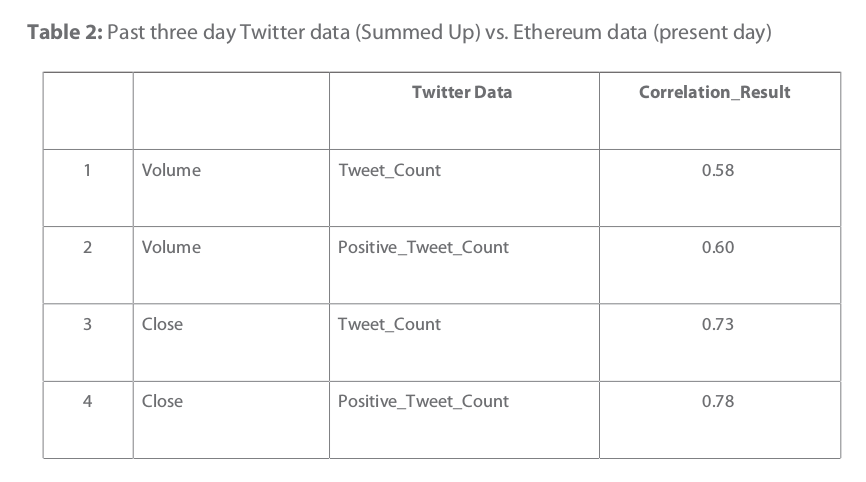 Results for Table 2:
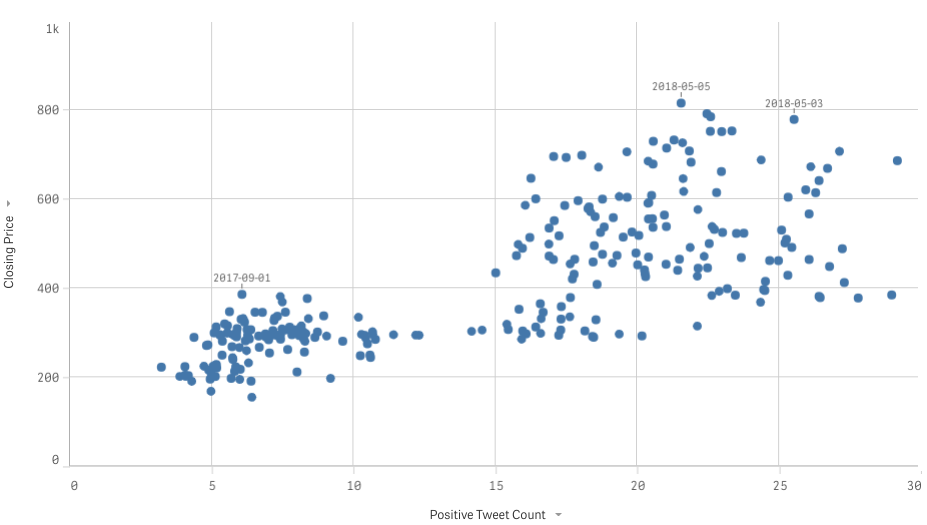
Figure 10 is the graph representing three days of Positive Tweet Count Summed up using ìExponential Smoothingî (in x-Axis) with 4th day Closing Price of Ethereum (in y-axis). Result of correlation: 0.78 This is better than the correlation obtained from all the above-mentioned scenarios
Figure 11 11 is the graph representing three days of Positive Tweet Count Summed up using ìExponential Smoothingî (in x-Axis) with 4th day Volume of Ethereum (in y-axis). Result of correlation: 0.60 It was found that one day previous data of Twitter have more effect on Ethereum Volume than all the other cases
Conclusion:
- It was found that Ethereum Volume had better correlation with Positive Tweet count of previous day (Figure 5) than any other case
- When it comes to Ethereum Price, the correlation was better with Positive Tweet count of the past three days (Summed Up Using ìExponential Smoothingî) (Figure 10) than any other case
Appendix:
Figure 2:
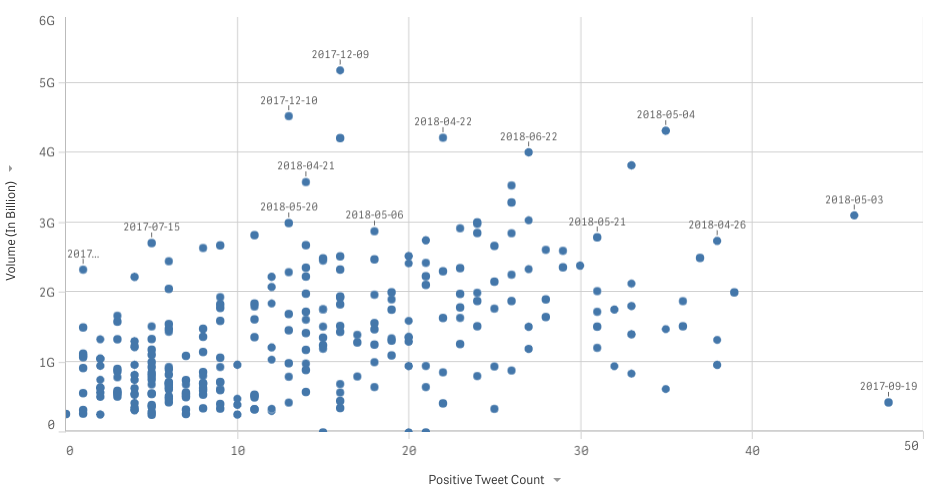
Figure 3:
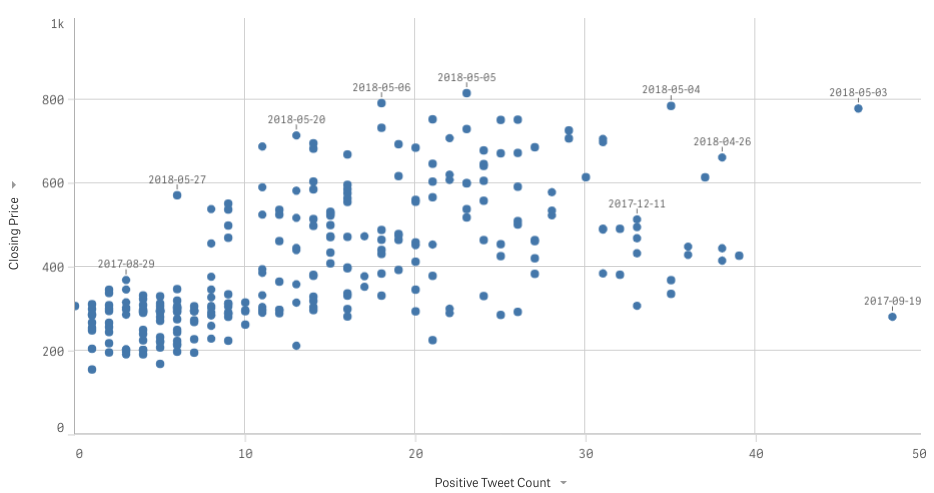
Figure 4:
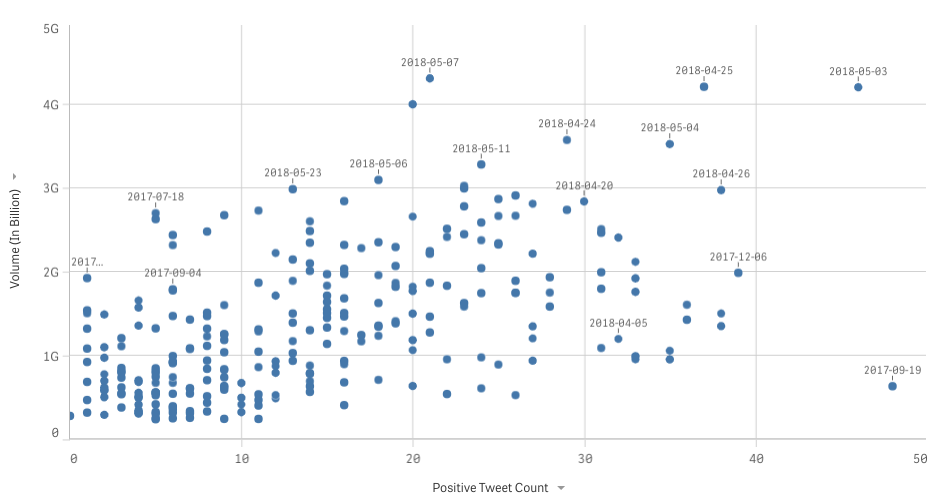
Figure 5:

Figure 6:
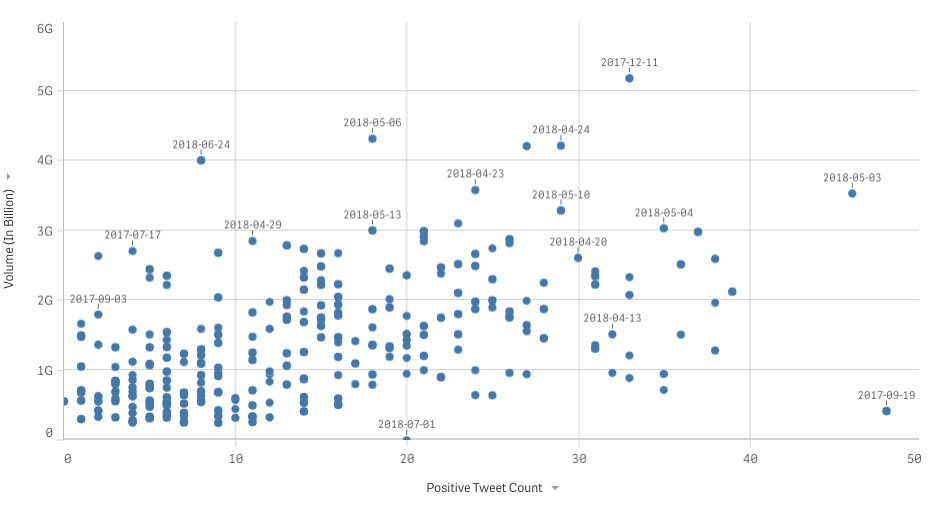
Figure 7:

Figure 8:
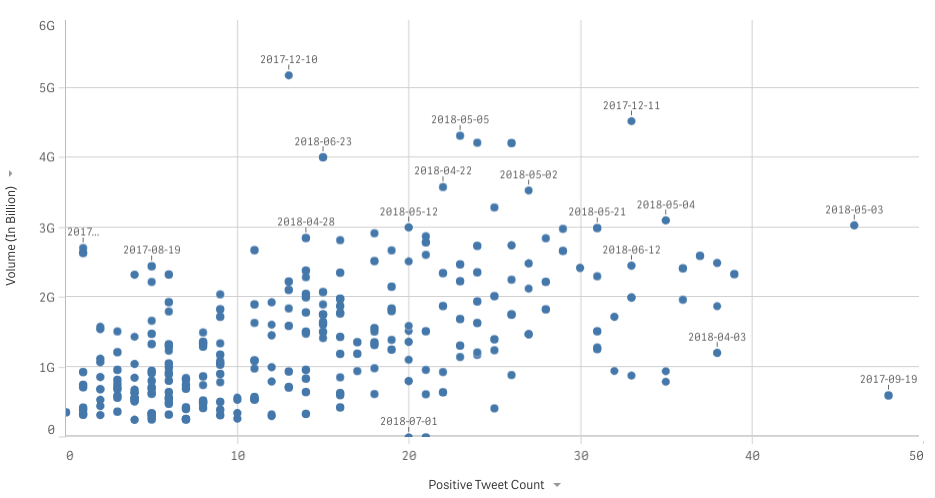
Figure 9:
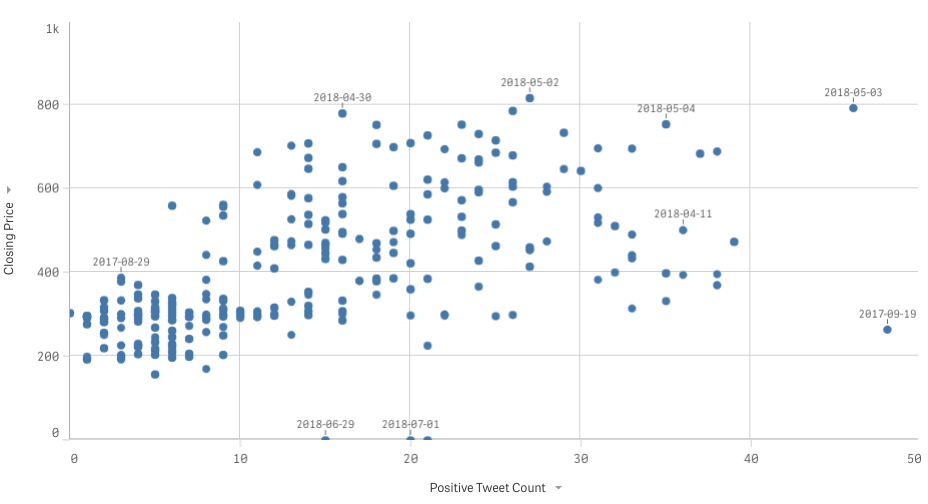
Figure 10:

Figure 11:
